

2020 will be remembered by all, for a host of reasons. For those in the ag world, the Phase One Agreement between the United States and China will certainly be one of them. Signed on January 15, 2020, and in effect as of February 14, 2020, the agreement set lofty goals for U.S. agricultural exports to China. Now that all the data for calendar year 2020 is available, it’s time to see what went right and what did not.
The Agreement
Phase One laid out a plan for China to purchase $12.5 billion in agricultural products above what they purchased in 2017, which was chosen as a baseline because it was the last “normal” year of trade between China and the United States before the two nations started trading retaliatory tariffs. In 2017, the U.S. exported $20.8 billion in products covered by the agreement to China. This would imply that in 2020, China would have to import $33.4 billion in U.S. agricultural products to fully meet the terms of the agreement. This is equivalent to a 60% increase over 2017 exports. The agreement also laid out that over the course of 2020 and 2021, total exports of U.S. agricultural products to China would increase by $73 billion, which is equivalent to $80 billion in Chinese imports, once shipping and freight are added.
Top-Line 2020 Numbers
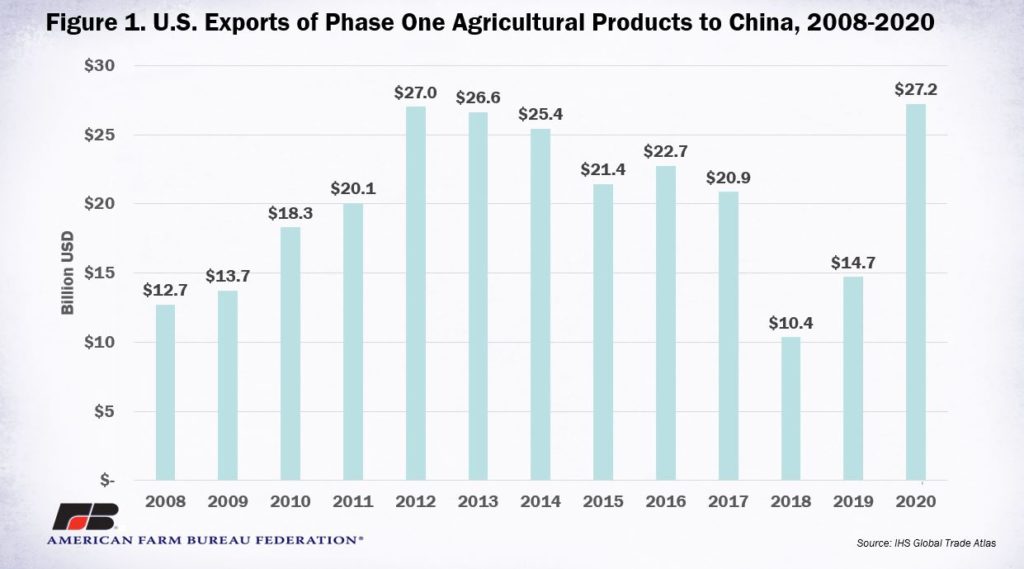
According to USDA data, total exports of agricultural and related products covered under the agreement reached approximately $27.2 billion in 2020, an increase of $6.5 billion over 2017 levels, equivalent to a 30% increase. This, of course, means the export target of $33.4 billion was missed by over $6 billion. Put succinctly – we only got about half-way to the target of $12.5 billion over 2017’s export levels. Despite the missed target, 2020 was a record for exports of agricultural products covered by the agreement, in nominal dollars.
Products that Had a Great Year
Despite the fact U.S. agricultural exports overall missed the target for the 60% increase over 2017 levels, some specific products had banner years. For example, the following products all set new nominal export levels to China in 2020: pork ($2.1 billion), poultry ($761 million), tree nuts ($705 million), hay ($445 million), beef ($304 million), peanuts ($239 million) and pulses ($51 million). Meanwhile, exports of some other products, though they didn’t set records, certainly exceeded 2017 levels with ease: corn, at $1.2 billion, was 693% above 2017 levels and wheat, at $570 million, was 62% above 2017 levels.
Current Outstanding Sales
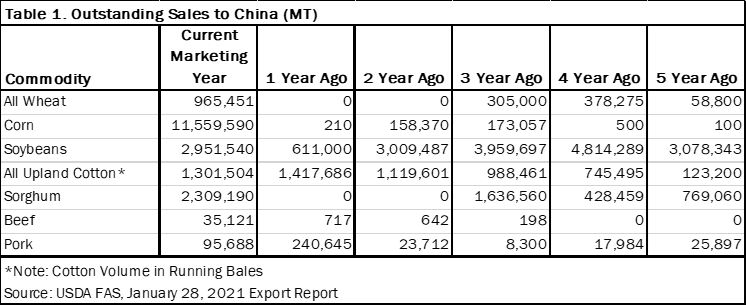
Over the course of the last few weeks and months many headlines have covered the seismic sales of U.S. farm commodities to China. While it is not at all uncommon for China to cancel sales for a variety of reasons. USDA’s Foreign Agricultural Service tracks this information through the export sales reporting program. The program requires U.S. exporters to report sales of certain commodities to FAS each week. As of January 28, the U.S. had a variety of commodities with large volumes of outstanding sales (Table 1). U.S. exporters had nearly 3 MMT in soybeans and more than 1.3 million bales of cotton in outstanding sales to China, which is largely in line with previous years. However, the outstanding sales of more than 11.5 MMT in corn, 2.3 MMT in sorghum, nearly 1 MMT in wheat and 35 TMT in beef are far above previous years, indicating a large potential upside in 2021. Also, of note, while outstanding sales of pork are well below year-ago levels, the 95 TMT is huge compared to every year except last year.
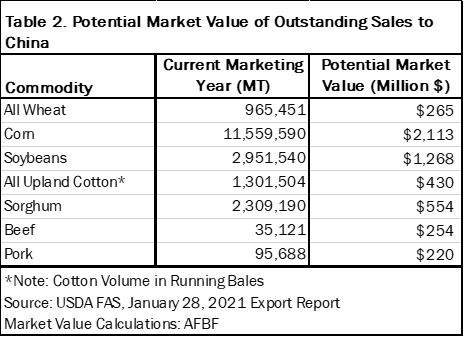
The export sales reporting system only reports the volume of commodities. However, using FAS’ Global Agricultural Trade System, one can use reported value and volume of exports to calculate an implied export value of those products. Table 2 uses fourth quarter 2020 values and volumes for each commodity sent to China to calculate a recent “implied export value” and from there comes a rough estimate of the potential value of these outstanding sales. Using these assumptions, the U.S. has over $5.1 billion in outstanding sales of soybeans, corn, wheat, cotton, sorghum, beef and pork to China.
Looking Ahead to 2021
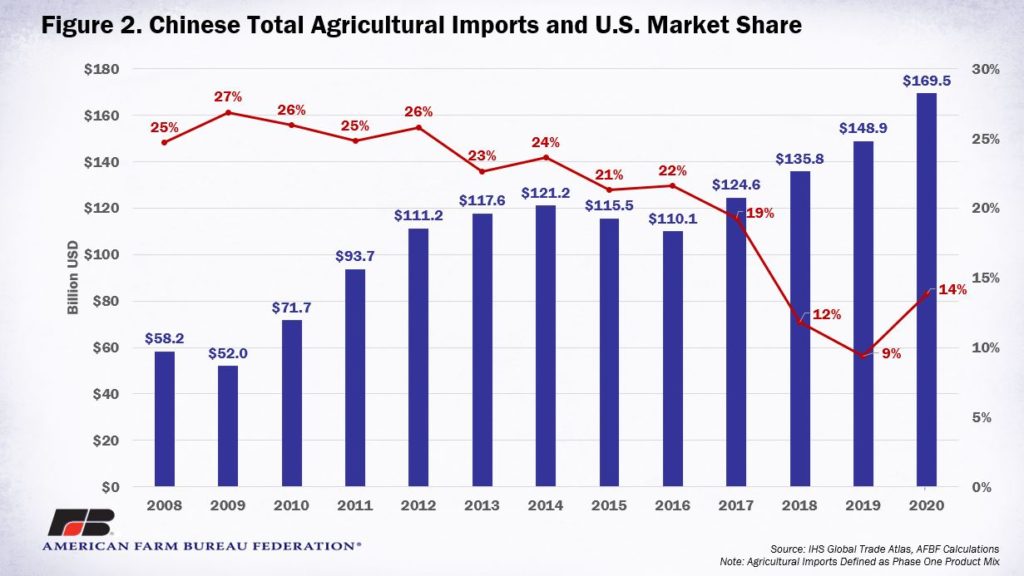
In 2020 U.S. agricultural exports reached a new record and the U.S. share of total Chinese agricultural imports rebounded from the very low levels seen in 2018 and 2019. However, the U.S. still only has 14% of the total Chinese ag import market of nearly $170 billion.
The missed target in 2020 also has implications for 2021, given that the Phase One Agreement is a two-year commitment. With 2020 exports of $27.2 billion to reach the two-year, $73 billion commitment, U.S. agricultural exports to China in 2021 will need to reach about $45.8 billion. This would be equivalent to a nearly 69% increase in exports over 2020 levels and a whopping 120% increase over 2017.
