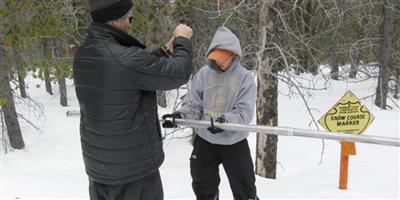
Source: Montana NRCS
BOZEMAN, Mont., January 6, 2016—The 2016 water year, which began on Oct. 1, 2015, started with below average precipitation across the state. November and December brought rain and snow storms, adding to the mountain snowpack. Moist southwest flow yielded the most significant snowfall in the southern half of the state, where most basins are near to slightly above normal for January 1.“Normally, October is the transition month from drier summer weather to more widespread and wetter fronts,” said Lucas Zukiewicz, water supply specialist for the Natural Resources Conservation Service (NRCS). “This year things transitioned pretty quickly when a storm soaked the northwest part of the state and started the seasonal snowpack elsewhere.”
“We welcomed that precipitation, considering last year’s conditions in this region,” Zukiewicz said. From June 1 to October 1, 2015, 20 of the 39 SNOTEL sites west of the Divide had the lowest precipitation in 35 years of record.
Snowpack in the northern river basins (Sun-Teton-Marias River, St. Mary-Milk, Kootenai, Flathead and Lower Clark Fork) is below normal at this time.
“Late fall and early winter precipitation in the northern basins appeared to bring the snowpack back to normal for the new year, but high pressure and little measureable snowfall during the last week of December caused the basin percentages to drop,” Zukiewicz said.
The Tongue, Powder and Bighorn River basins’ snowpacks are well below normal, and some SNOTEL sites in the Bighorn Range are experiencing record low snowpack for this date.
Last year, where warm and dry conditions were the persistent weather pattern through spring and summer, runoff was less than desirable—due to the lack of snowpack and precipitation in many mountain and valley locations. Because of the substantial snowpack in 2014, reservoirs had winter carryover available to help sustain rivers and irrigation ditches. Rivers and streams without on-stream storage ran pretty low, in some cases record low.
Entering this water year, October 1 reservoir storage was near to slightly above average in most basins and well above average in the Smith-Judith-Musselshell River basin. Due to the low snowpack, below average streamflow, and irrigation demand the Bitterroot, Jefferson and Sun-Teton Marias River, basins have some reservoirs that are well below average for this date.
Since only 35 to 40 percent of the seasonal snowpack has accumulated at this time, making predictions on what is yet to come is difficult. “Being optimistic, there is plenty of time for conditions to improve in basins that are below normal,” Zukiewicz said. “This early in the season, one large storm can push the basins above normal for any given date, but the end goal of the snow season is to have a normal snowpack in April or May when we transition to runoff.” Zukiewicz said a strong dose of caution is always realistic.
“At this time last year, our snowpack across the state looked to be in good condition only to make a turn for the worse later in the spring,” he said. “The coming months will tell us what El Nino will mean for Montana’s snowpack as we reach our peak snowpack and enter spring runoff.”
Monthly Water Supply Outlook Reports can be found here: http://www.nrcs.usda.gov/wps/portal/nrcs/main/mt/snow/waterproducts/basin/
|
January 1, 2016 Snow Water Equivalent |
||
|
River Basin |
Jan. 1 Percent of Normal |
Percent of Last Year |
|
Columbia |
91 |
83 |
|
Kootenai, Montana |
90 |
113 |
|
Flathead, Montana |
77 |
70 |
|
Upper Clark Fork |
104 |
79 |
|
Bitterroot |
105 |
84 |
|
Lower Clark Fork |
87 |
112 |
|
Missouri |
106 |
98 |
|
– Jefferson |
120 |
103 |
|
– Madison |
100 |
112 |
|
– Gallatin |
99 |
98 |
|
Headwaters Mainstem |
118 |
94 |
|
– Smith-Judith-Musselshell |
105 |
94 |
|
– Sun-Teton-Marias |
79 |
70 |
|
St. Mary-Milk |
85 |
93 |
|
Yellowstone River Basin |
82 |
75 |
|
Upper Yellowstone |
96 |
83 |
|
Lower Yellowstone |
70 |
69 |
|
West of the Divide |
91 |
83 |
|
East of the Divide |
94 |
88 |
|
Statewide |
96 |
88 |
|
Precipitation |
|||
|
River Basin |
Monthly |
Water Year |
Water Year |
|
Columbia |
140 |
107 |
91 |
|
Kootenai |
162 |
122 |
112 |
|
Flathead |
131 |
96 |
79 |
|
Upper Clark Fork |
122 |
103 |
85 |
|
Bitterroot |
141 |
108 |
83 |
|
Lower Clark Fork |
139 |
106 |
94 |
|
Missouri |
133 |
109 |
103 |
|
– Jefferson |
151 |
113 |
107 |
|
– Madison |
134 |
103 |
116 |
|
– Gallatin |
131 |
110 |
109 |
|
Headwaters Mainstem |
139 |
101 |
87 |
|
Smith-Judith-Musselshell |
134 |
110 |
107 |
|
Sun-Teton-Marias |
105 |
89 |
71 |
|
St. Mary-Milk |
137 |
121 |
101 |
|
Yellowstone |
105 |
92 |
91 |
|
Upper Yellowstone |
124 |
109 |
105 |
|
Lower Yellowstone |
89 |
80 |
64 |
|
West of the Divide |
140 |
107 |
91 |
|
East of the Divide |
122 |
101 |
98 |
|
Statewide |
135 |
107 |
96 |
Photo courtesy of USDA Natural Resources Conservation Service


