
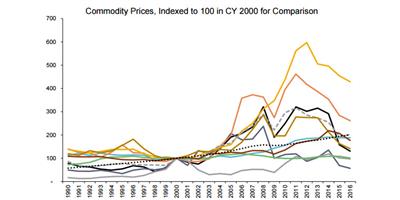
In the past 16 years, many commodities have seen huge prices increases, followed by big declines. But when you index them on the same chart, it is quite revealing as to which ones have done better, or worse.
Whether you Farm a commodity, or Mine one, or Drill for one, the “Historical Commodity Prices” chart published this week by the Montana Legislature’s Fiscal Division may surprise you.
Cattle, Gold and Oil have similar 16-year trends since 2000. But look at Coal, and Wages, and Timber…which show a much different price history by comparison.
Would it amaze you that Timber and Palladium are the only two commodities that are almost exactly at the price where they were 16 years ago?
Can you guess the ONLY commodity that is priced BELOW where it was 16 years ago in 2000? (Surprise! It is NOT Wheat.)

http://leg.mt.gov/content/Publications/fiscal/2016{75e25ebeb47fb4337942be2c10689dca1c292c2a66240b62c5ca4214f5b25ecc}20Chart{75e25ebeb47fb4337942be2c10689dca1c292c2a66240b62c5ca4214f5b25ecc}20of{75e25ebeb47fb4337942be2c10689dca1c292c2a66240b62c5ca4214f5b25ecc}20the{75e25ebeb47fb4337942be2c10689dca1c292c2a66240b62c5ca4214f5b25ecc}20Week/Outlook/cotw-commodities.pdf
© Northern Ag Network 2016
