
by Darin Newsom, DTN Senior Analyst
OMAHA (DTN) — Before we get started, let me say that I'm not calling the June 30 reports a joke, but rather comparing them to the jokers in a standard deck of cards. A quick research of the joker's history shows it to be viewed either as a wild card or the most important card in the deck (highest trump). The same could be said for the Quarterly Stocks and Planted Acreage reports.
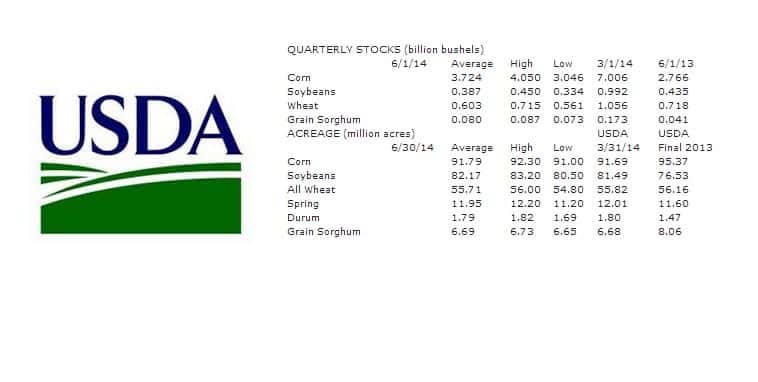
USDA will release its Acreage and quarterly Grain Stocks reports at 11 a.m. CDT Monday.
QUARTERLY STOCKS
The most important numbers in this report will be soybeans and corn, with the soybean number taking the trick. The average pre-report estimate for beans came in at 387 million bushels, a number that immediately led to some serious recalculation of the value of the old-crop hand. Plugging that number into my quarterly demand spreadsheet, if realized, would imply third-quarter usage of 17.2{0a3336b3da8cf935de4f3eb78fe29508c4b8b5ebd27d01af2d815614325d533e} of total supplies (3.519 billion bushels). This would be the lowest Q3 demand percent for more than 20 years. Even the benchmark year of 2003-2004 (record-low ending stocks of 112 mb and 4.5{0a3336b3da8cf935de4f3eb78fe29508c4b8b5ebd27d01af2d815614325d533e} ending stocks to use) saw Q3 usage of 18.8{0a3336b3da8cf935de4f3eb78fe29508c4b8b5ebd27d01af2d815614325d533e} of total supplies (2.638 bb). In 2009-2010 (another marketing year with 4.5{0a3336b3da8cf935de4f3eb78fe29508c4b8b5ebd27d01af2d815614325d533e} ending stocks to use) the Q3 figure was 19.9{0a3336b3da8cf935de4f3eb78fe29508c4b8b5ebd27d01af2d815614325d533e}.
It is possible USDA could come in with this “large” of a quarterly stocks number given that the June Supply and Demand report (released on June 11) resulted in 2013-2014 ending stocks to use of 3.7{0a3336b3da8cf935de4f3eb78fe29508c4b8b5ebd27d01af2d815614325d533e}. It is possible that Q3 demand did fall well short of its five-year average of 21{0a3336b3da8cf935de4f3eb78fe29508c4b8b5ebd27d01af2d815614325d533e} of total supplies. But what if it didn't?
Here's a couple of different scenarios: If Q3 demand was closer to what was seen in 2009-2010 (18.8{0a3336b3da8cf935de4f3eb78fe29508c4b8b5ebd27d01af2d815614325d533e}), USDA'S quarterly stocks number would be closer to 330 mb (near the low end of pre-report estimates). If Q3 demand was in line with the five-year average (21{0a3336b3da8cf935de4f3eb78fe29508c4b8b5ebd27d01af2d815614325d533e}), quarterly stocks would drop to almost 250 mb. The real hole card is that whatever the quarterly stocks number is (387 mb, 330 mb or 250 mb) near-normal Q4 demand (12.5{0a3336b3da8cf935de4f3eb78fe29508c4b8b5ebd27d01af2d815614325d533e}) would result in marketing-year ending stocks well below zero. Worst case scenario, if USDA is near the pre-report estimate (387 mb), Q4 usage would have to drop to only 7.4{0a3336b3da8cf935de4f3eb78fe29508c4b8b5ebd27d01af2d815614325d533e} (a new-record low) of total supplies to come in at USDA's June ending stocks figure of 125 mb.
PLANTED ACREAGE
Corn is the trump suit when it comes to USDA's acreage numbers. Similar to 2013, much of the debate over the last number of weeks has been about lost corn acres going to soybeans due to flooding, predominantly in northern Iowa and southern Minnesota. This is where the discussion bogs down. Pre-report estimates are looking for corn acres to INCREASE to about 91.8 million acres, up roughly 100,000 acres from the June Supply and Demand report estimate of 91.7 ma. Is it possible U.S. corn producers actually planted more corn than expected, despite lost acres in Minnesota? If so, will the differential between harvested and planted acreage grow from the average 92{0a3336b3da8cf935de4f3eb78fe29508c4b8b5ebd27d01af2d815614325d533e} due to abandonment in the July round of supply and demand reports?
If USDA is in line with the pre-report estimate of 91.8 ma, and all other calculations are left unchanged from the June Supply and Demand report, crop production would come in just below 14 bb and 13.95 bb (the June figure was 13.935 bb). Total supplies would climb to 15.127 bb, leading to a slight increase in both ending stocks (1.742 bb) and ending stocks to use (13.0{0a3336b3da8cf935de4f3eb78fe29508c4b8b5ebd27d01af2d815614325d533e}). It's interesting to note that the latter, ending stocks to use, would be similar to what was seen at the end of the 2009-2010 marketing year when USDA calculated the average annual farm price at $3.55.
WHAT THE MARKET IS SAYING
Gauging the commercial view of old-crop supply and demand for soybeans is made more difficult by the time lag in the report. Quarterly stocks are as of June 1, so should we look at how soybean spreads acted from the beginning of March through the end of May, or do we look at what has happened since early June? If we use the former, the nearby futures spread saw its inverse strengthen from 1/4 cent at the end of February to 68 3/4 cents when May came to a close. Similarly, national average basis firmed from 43 cents under (DTN National Corn Index minus the nearby futures contract) at the end of February to 21 cents under at the end of May. Both would imply Q3 demand was stronger for old-crop soybeans than what the average pre-report estimate would suggest.
As for corn acres, the new-crop December-to-March futures spread has seen its carry strengthen from 6 1/4 cents in early April to 10 3/4 cents this week. Measured on a full cost of carry (total cost for holding the grain in commercial storage) scale the spread is approaching bearish levels. This would suggest that it is possible more acres were seeded, living up to the old idea that once corn planters start rolling, they keep rolling. That being the case, a USDA acreage number near the pre-report estimate isn't out of the question, according to what the market has been saying.
So what about wheat? Neither the quarterly stocks number nor the planted acreage estimate is expected to bring much change to the overriding bearishness of the market. The average pre-report estimate for Q4 stocks (ending stocks) of 603 mb is 10 mb larger than what USDA projected in its June Supply and Demand report. All wheat planted is expected to drop by about 100,000 acres to 55.7 ma.
When Monday has come and gone, it is highly likely that the June 30 reports live up to their billing as the joker. As a wild card, the reports have been described (correctly I might add) as random and unpredictable. The knee-jerk reaction could follow suit, contracts off on volatile trading tangents. Others view this set of numbers as setting the new standards going forward, or in other words, trumping everything else that has happened up to this point.

© Copyright 2014 DTN/The Progressive Farmer. All rights reserved.
Posted with DTN Permission by Haylie Shipp
